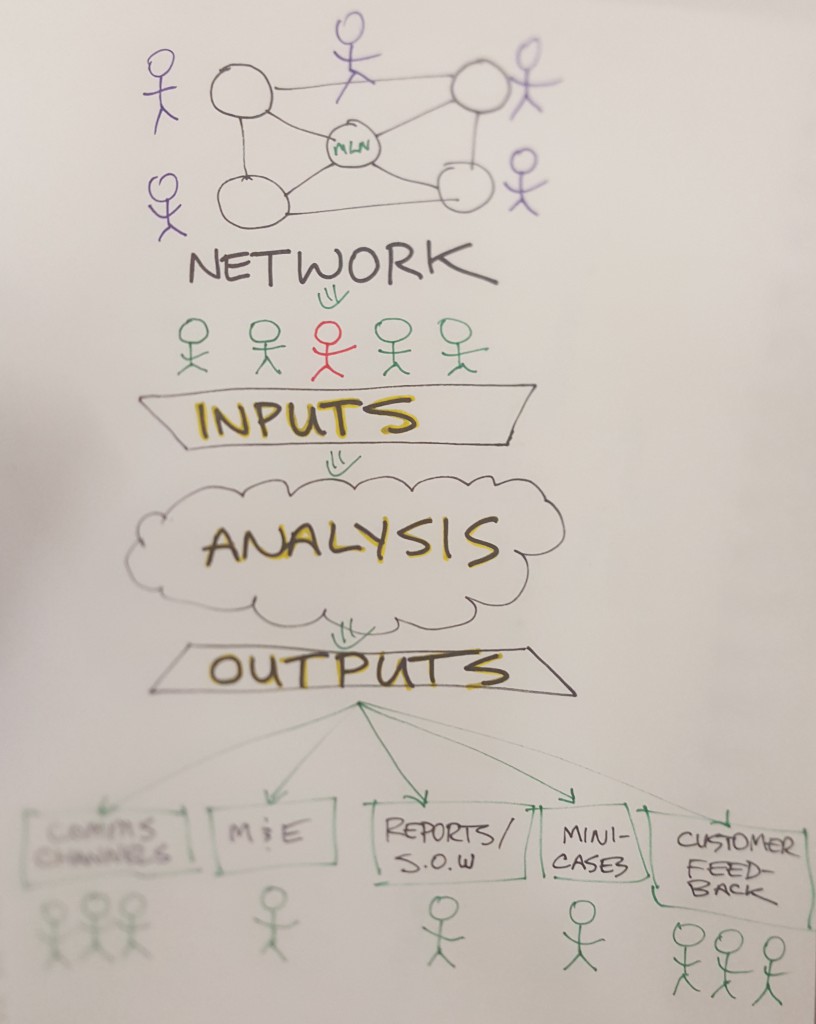
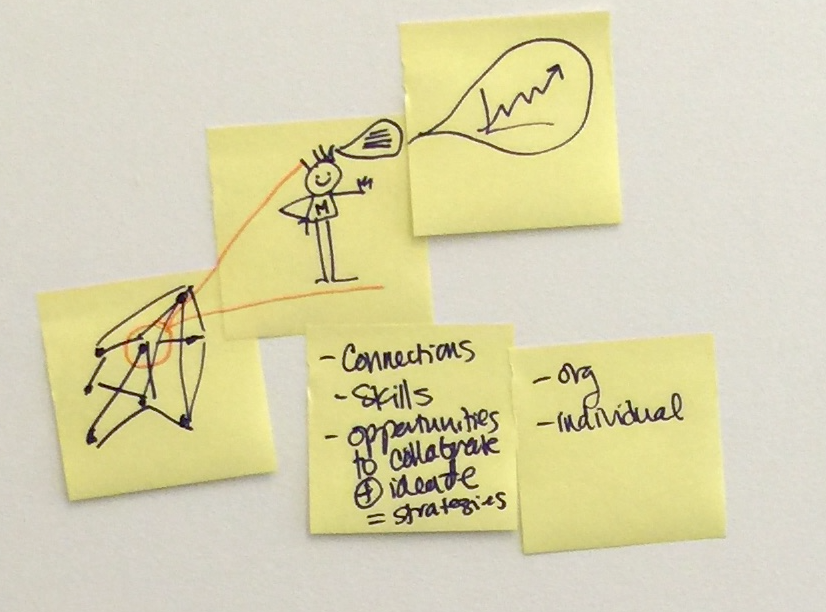
Our network is full of stories. Correctly applied, they can help us illustrate how the Mozilla Leadership Network acts as a magnet, training ground and recharge station for innovators and leaders protecting the web.
The challenge: right now, these stories are not captured in a systematic way across the network. That makes them hard to gather, understand and use to inform strategy. So…
How can we systematically aggregate, analyze and act on this qualitative data and raw material?
Our goal for this sprint:
Design a prototype story engine
Essentially: an MVP system to collect evidence narratives. These structured stories can serve as qualitative data, raw material for outreach and fundraising, feed into our various comms channels, and strengthen our network.
First step: do a 3-day design sprint. Build a quick and dirty prototype. Then test it with a handful of key customer segments.
Why? To increase and measure our network strength. And continually highlight the human stories behind it.
Quantitative + Qualitative
We want the best of both worlds: the human power of stories combined with methodological rigour. Learning from other organizations (Greenpeace, Upwell) and building on tested approaches (Utilization Focused Evaluation, Outcome Mapping, Most Significant Change).
Who? In this initial sprint the team is my colleague Chris Lawrence, longtime Mozilla contributor Christine Prefontaine and OpenMatt. This was an intentionally small group to help us get to some MVP process and prototype to discuss and test with provide a surface area for further iteration and conversation.

Inspiring Story Examples
- Suchita’s story. A mini case study around leadership development for women’s digital literacy
- Iltimas Doha’s story. A video college application one of our Hive members used to get into Parsons Design School
- Learning Hub newsletter. Including community spotlights
- Mozilla Science Lab’s community profiles
Potential Methodologies
- Utilization-Focused Evaluation — an approach based on the principle that evaluation should be judged on its usefulness to intended users
- Most significant change — generating change stories focused on the most significant effects on the lives of beneficiaries
- Micro-narrative. (e.g., SenseMaker). “Linking micro-narratives with human sense-making for decision support, research and monitoring.”
- Outcome Mapping
Useful Resources & Reading
- Mozilla Foundation Strategic Plan
- Mozilla Leadership Network Q1 Review
- Sample research report from the Univ. of Washington’s “Tech & Social Change Group”
- Constellation model kit
- Yochai Benkler presentation on network influence maps in action
- Upwell’s networked narrative and Big Listening approach for ocean conservancy
Potential tools and software
- Open visualization platform (Gephi)
- Other tools for Quantitative Data Analysis (especially: ATLAS.ti and DEDOOSE)
- Visualize connections and patterns in data sets using MAXQDA
Related work
This project will touch on and potentially serve a bunch of different projects and initiatives already underway:
- Network mapping & surveys. We’re making “Network Strength” our core KPI. Gathering qualitative data through network surveys. Sub-KPIs:
- Alignment. How aligned are network members on our core issues?
- Connection. How connected are they to each other?
- Influence. Size, reach, etc.
- Membership. “The Mozilla Leadership Network” is a new concept. What do network members want? What are their motivations? What are the right incentives to offer based on. We’re testing and refining our value proposition / motivation. (Rizwan, a consultant, is helping w. this work here.)
- Curriculum. We’re building a curriculum around working open / open leadership. Some of the stories we collect can serve as mini-case studies / interviews / color for that curriculum. (Examples.)
- Insights group. Our “Insights” group helps identify what our core issue priorities are, and gathers research around what other leading orgs are doing / thinking on those topics. (e.g., Right now our core issue priorities are: web literacy, privacy, inclusion.)
- State of the Web. The Insights group publishes an annual report called “State of the Web.” It outlines how Mozilla / the world are doing on our core issues. Network member stories can provide ideal color and sidebars for this. It shows Mozilla as part of a network / movement, can provide quotes and pull-outs / sidebars for the report, and helps us keep our ear close to the ground. (Design brief.)
Kinds of data and stories we may want to collect:
1) What / Why
Alignment around our issues. What are network members doing / planning / thinking about our core issues? (e.g., web literacy, privacy / security / inclusion). And: why it matters. Inspire us and others about why these issues matter.
maps to: network alignment, communications
2) How
Alignment around working open / open leadership / tech-savvy collaboration.
How are you working on those issues? Open leadership / working open in action. Emerging best practises / inspiring examples of collaboration / lifehacker for work.
maps to: curriculum
3) Motivation / Customer Service
Testing and refining our Value Proposition. How can we serve our members better? How do we learn more about what network members / customers want? How do we get better market / customer data? Stories and data they help us make our programs and inititaives / products better.
maps to: Membership / value proposition
4) Celebrating successes
What does distributed winning look like?
maps to: Network Influence, communications

Very cool! Is this also related to the “Pulse” project we started awhile back? (https://github.com/MozillaFoundation/plan/issues/746)
Yes! Thanks for making that connection, Hannah.
Super exciting Matt (and Chris and Christine!). Love that you guys are digging into thinking about how different methods can help to surface insights and inform strategy, and it’s been very exciting for the Hive Research Lab team to see that the idea of ‘network health’ is becoming central in this work.
There are so many big questions to pose around this kind of work, but I’ll leave you guys with one that I think about often – what kinds of data (qualitative, quantitative, stories, frameworks, network maps, etc.) are used by whom, how often, and for what purposes?
To me, it’s really important to think about the purposes – measurement for accountability is different from measurement for research is different from measurement for improvement. Each implies different kinds of methods, different standards of rigor, different contexts and stakeholders involved in data collection, and importantly, sensemaking.
Looking forward to seeing what you all come up with!